- A Heatmap tile lets you add a heatmap to your Dashboard
- In the Dashboard edit screen, click on the “Create: Tile” button and choose for a “Heatmap” tile.
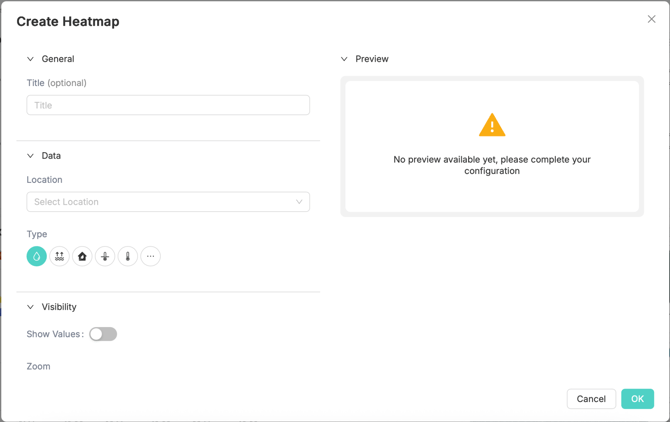
- You can fill in a name for the tile under “Title”
- Under the “Data” tab you can select which data you would like to show in the tile.
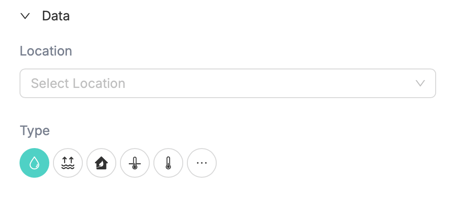
- With the location drop-down menu you can select the location you want to use.
- You can zoom down to placement level, in case you want to only show the sensors for a certain compartment for example.
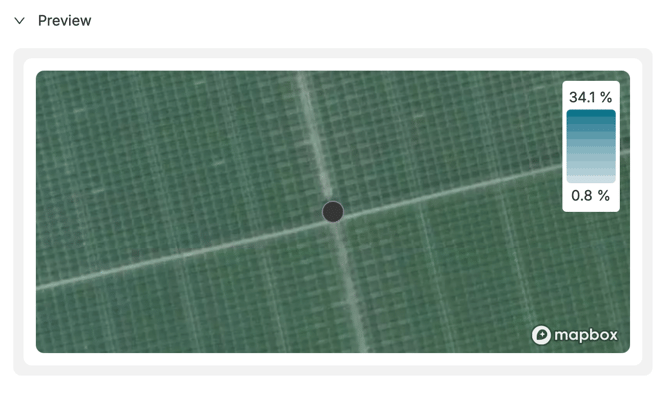
- The locations coordinates will be used to determine the center of the heatmap
- Under “Type” you can choose what measurement type you want to show in the heatmap
- You can select all measurement types that you have available in your regular Growboard
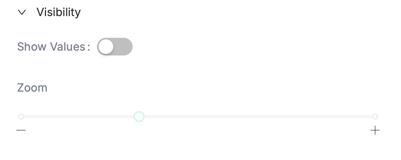
- Under “Visibility” you can choose if you want to show the measurement values by default with the “Show values” toggle
- Finally you can zoom in or out on the heatmap via the Zoom slider.
- Finally, in the “Preview” field you can immediately see how the tile will be shown on the dashboard.
- Click on “Ok” to add the tile to the dashboard
Note! Make sure to click Save before exiting your Dashboard. Changes are not automatically saved.