- A sSingle Value tile lets you add a single value of any of your measurements
- In the Dashboard edit screen, click on the “Create: Tile” button and choose for a “Single value” tile.
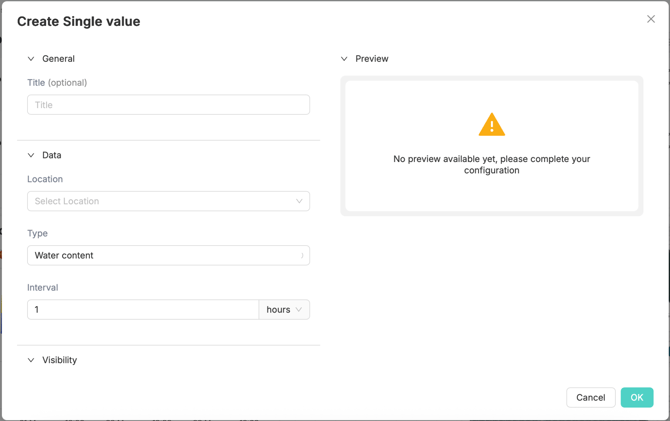
- You can fill in a name for the tile under “Title”
- Under the “Data” tab you can select which data you would like to show in the tile.
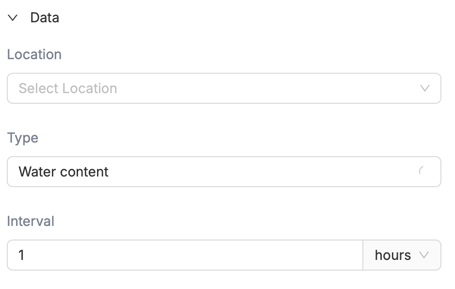
- With “Location” you can select which datapoint you would like to show.
- This can be any level in the Growboard, from company till placement level.
- With “Type” you can select the Type of the value you want to show.
- Here you will have the same options available as in your Growboard
- With the “Interval” you can choose the interval range of the data you want to show
- You can show data in intervals of hours, days or weeks
- In the “Visibility” tab you can set the styling of the tile.
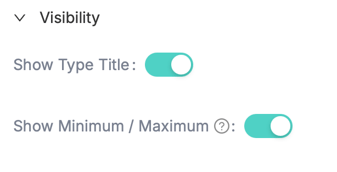
- With the ‘Show type Title’ toggle you can turn the title of the Tile on / off
- With the Minimum / Maximum toggle you can choose whether to show the minimum and maximum values or not
- Finally, in the “Preview” field you can immediately see how the tile will be shown on the dashboard.
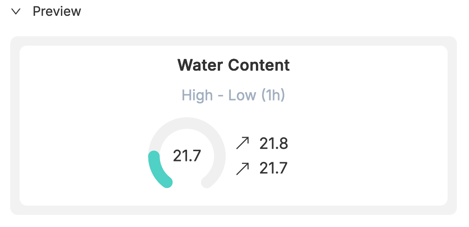
- Click on “Ok” to add the tile to the dashboard
Note! Make sure to click Save before exiting your Dashboard. Changes are not automatically saved.