- A Table tile lets you add a table comparable to the default overview
- In the Dashboard edit screen, click on the “Create: Tile” button and choose for a “Table” tile.
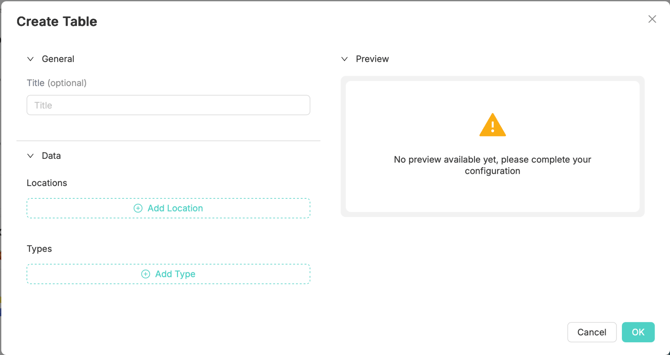
- Under the “Data” tab you can select which data you would like to show in the tile.
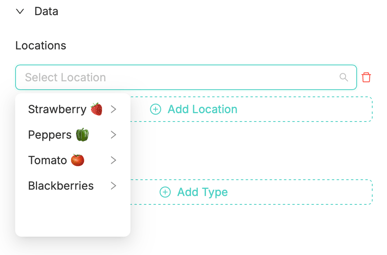
- With the “Add Location” button you can add a new location line to the table
- Each location will be shown as a separate horizontal line in the table
- You can select a measurement on any level, allowing you to have location measurements or compartment measurements for example in the same table
- With the “Add type” button you can add the measurement type to the table
- The measurement types will be shown as vertical column in the table
- This type will be shown for every location you have added (when available)
- All measurements that you have available in the Growboard can be selected here
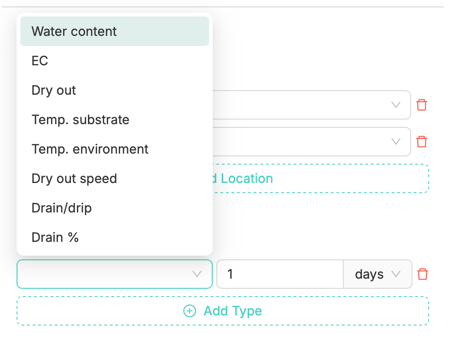
- By default the data will be shown of the current day
- With the “Interval” you can choose the interval range of the data you want to show
- You can show data in intervals of hours, days or weeks
- Finally, in the “Preview” field you can immediately see how the tile will be shown on the dashboard.
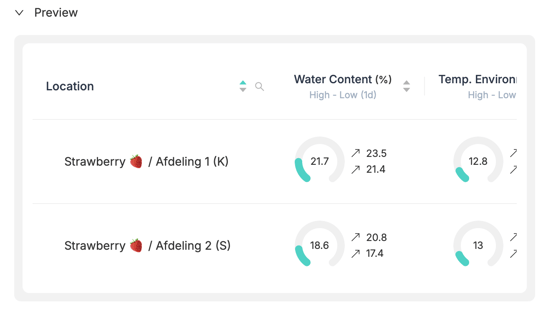
- Click on “Ok” to add the tile to the dashboard
Note! Make sure to click Save before exiting your Dashboard. Changes are not automatically saved.