![Growficient_donkergroen copy.png]](https://help.growficient.com/hs-fs/hubfs/Growficient_donkergroen%20copy.png?height=40&name=Growficient_donkergroen%20copy.png)
You can quickly see the water uptake of your plants via our dry out graph of the Growboard. The dry out graph gives you clear insight to the percentage the substrate that dries down in between each irrigation shot.
We created our dry out speed graph to visualize shows how a plant is uptaking water. The graph shows precisely if and when the plant is active, and needs faster irrigation. This is particularly helpful during dark and wet days, when using misting/shading, or any other days when evaporation might change or be unpredictable.
The higher the dry out, the drier the substrate becomes, meaning more generative plant activity. However, the speed at which your substrate dries is also very important. If your plant is evaporating quickly, you need to irrigate sooner compared to when the plant is not evaporating at all. Essentially, the graph represents how much stress a plant experiences.
With the following steps you can open your dry out speed graph:
- Open a graph for the level you want to view
- In the graph menu bar, click the button with 3 dots and select ‘Dry out’ Speed
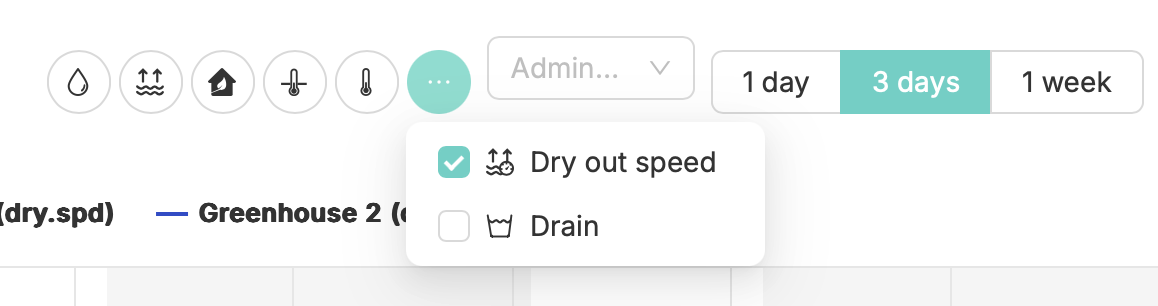
- You will now see the dry out speed graph
- The dry out speed is the percentage that the dry out increases or decreases per hour
- This is how fast the plant is uptaking water from the substrate
- The lower the dry out speed, the slower the water uptake
- The higher the dry out speed, the faster the plant uptakes water
In order to explain the benefits of the dry out speed and the insight it might bring, please take a look at the following examples:
Example 1: See when your plant is active
- In the example above you can see when the plant is actively uptaking water
- You can see that the speeds starts to increase from 7:30AM and is around max speed around 7:30PM
- With this you can finetune your irrigation start and first drains based on actual plant needs
- Furthermore, you can see that most activity is between 13:00 and 17:00, meaning the plant needs the most frequent irrigation and drain during this period to prevent stress on the plant and rise in EC
- You can also see that there is reduced activity after 19:00, helping you fine-tune your last irrigation shot
Example 2: Differences between dark/light days
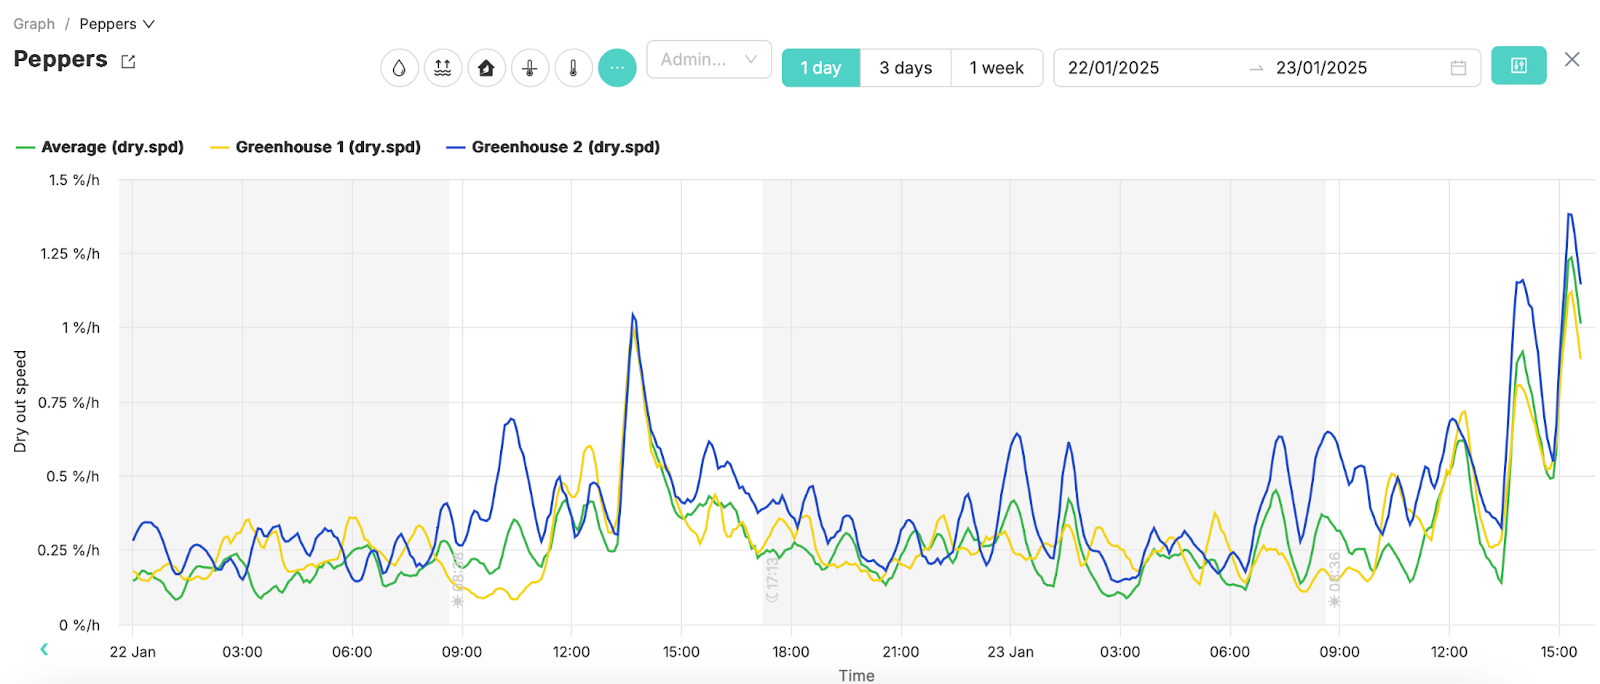
- In this example you can see that on Jan 22nd the plant was a lot less active compared to Jan 23rd
- Furthermore, the plant only became active after noon with barely any activity before that
- This can also be seen in the dry out graph
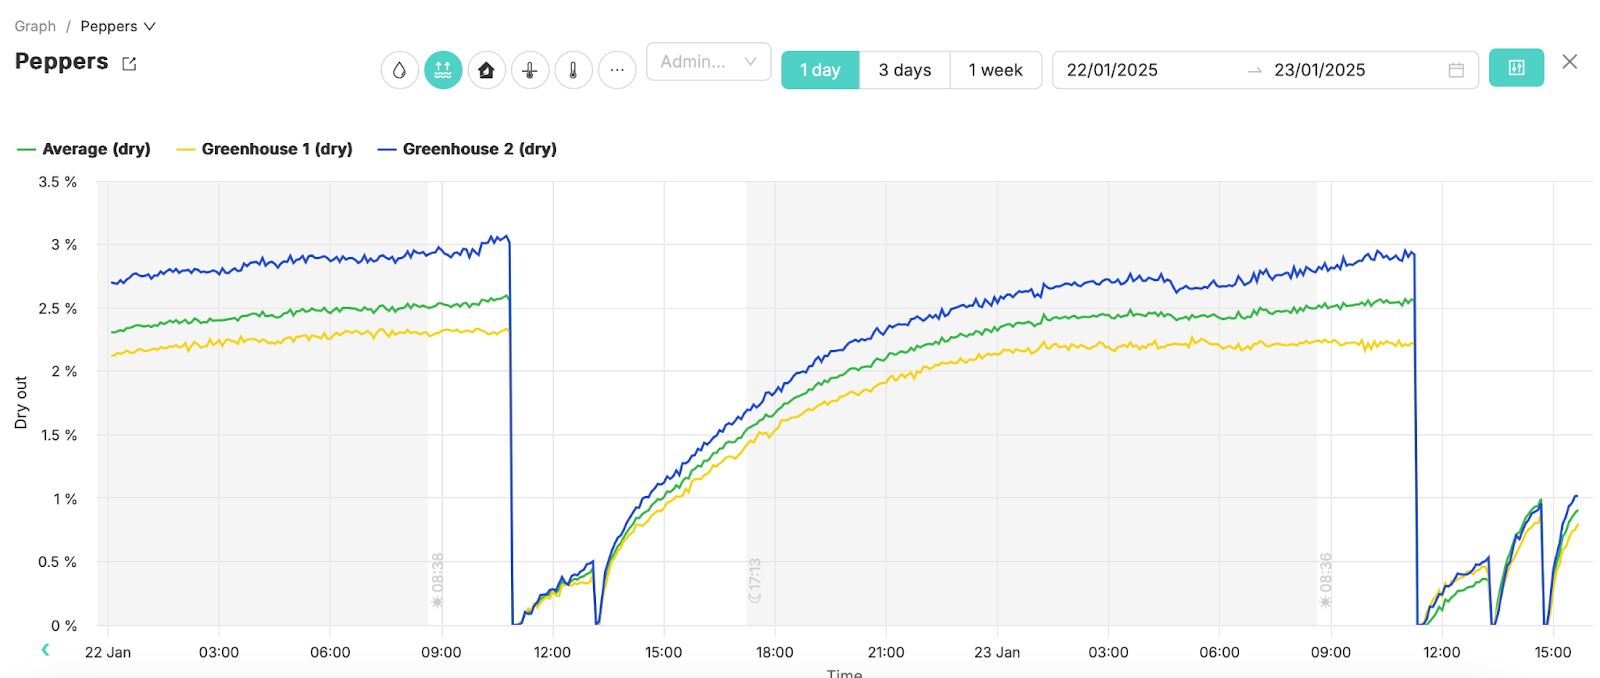
- On the 23rd, you can see that after the first shot the dry out was lower compared to the second shot
- That means the plant received more water than necessary and, thus creates vegetative growth and/or extra root pressure
- In this case, it may be beneficial to delay the second shot to be able and reach sufficient enough dry out
Example 3: Difference between two greenhouses
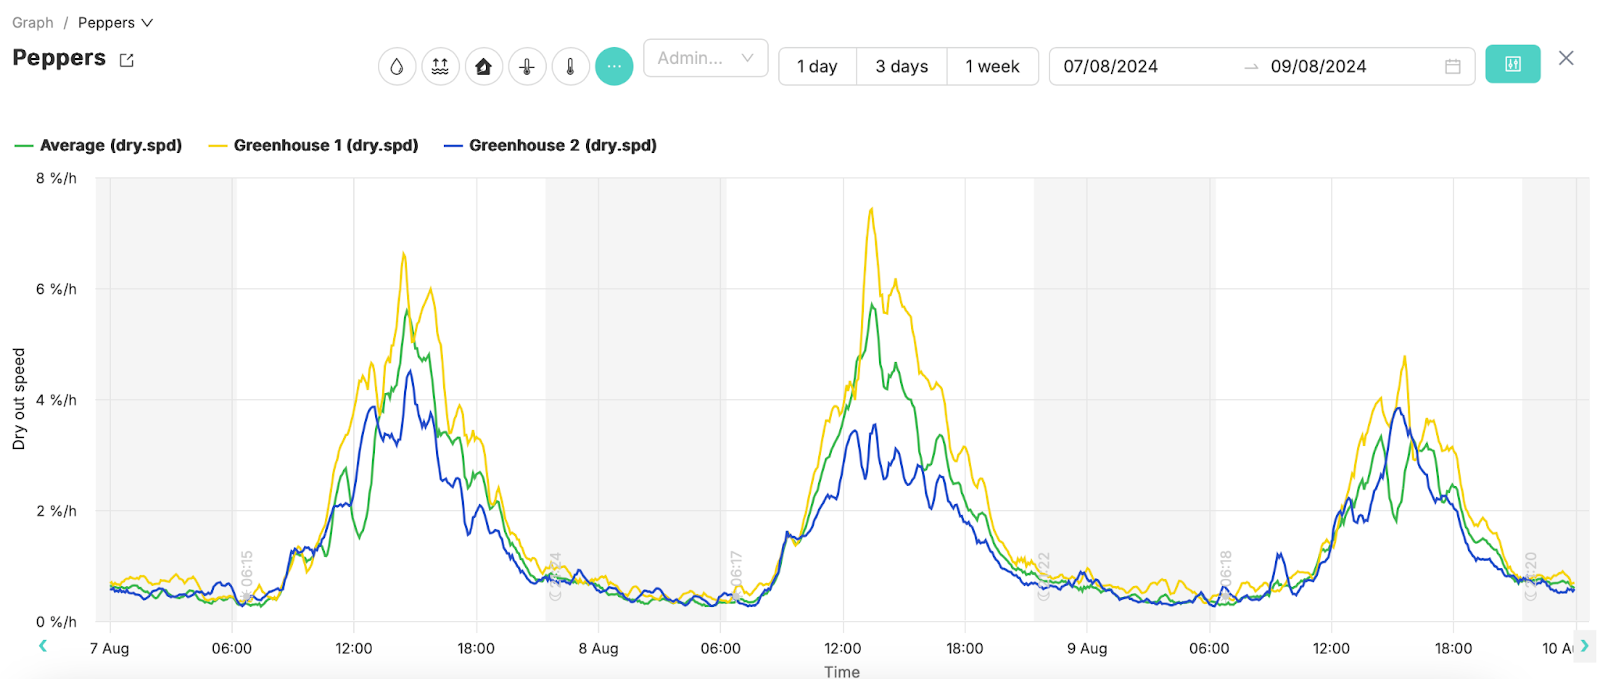
- In this example, you can see that both greenhouses have strong plant activity on the 7th
- However, on the 8th, only Greenhouse 1 has significantly faster water uptake
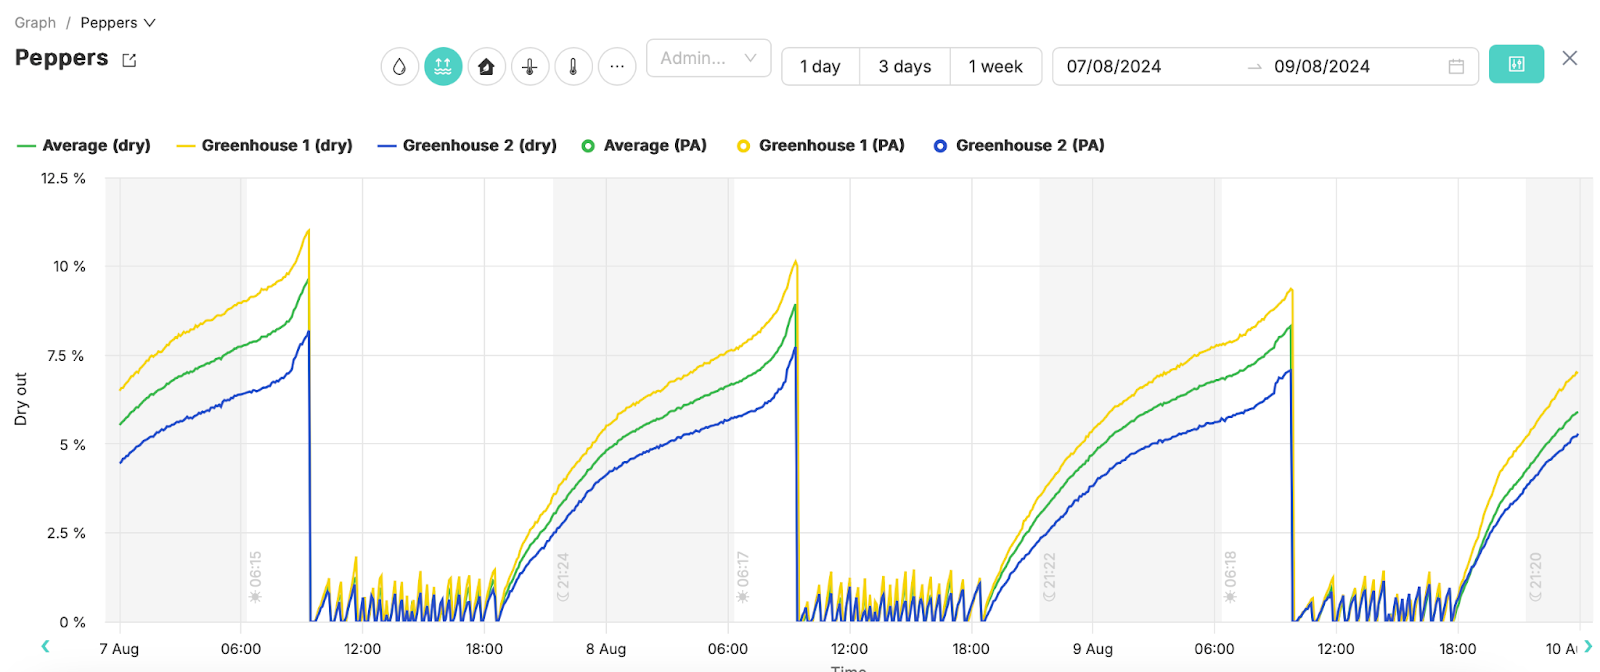
- When we look at the dry out graphs, you will also see that the general dry back is higher in Greenhouse 1 compared to Greenhouse 2
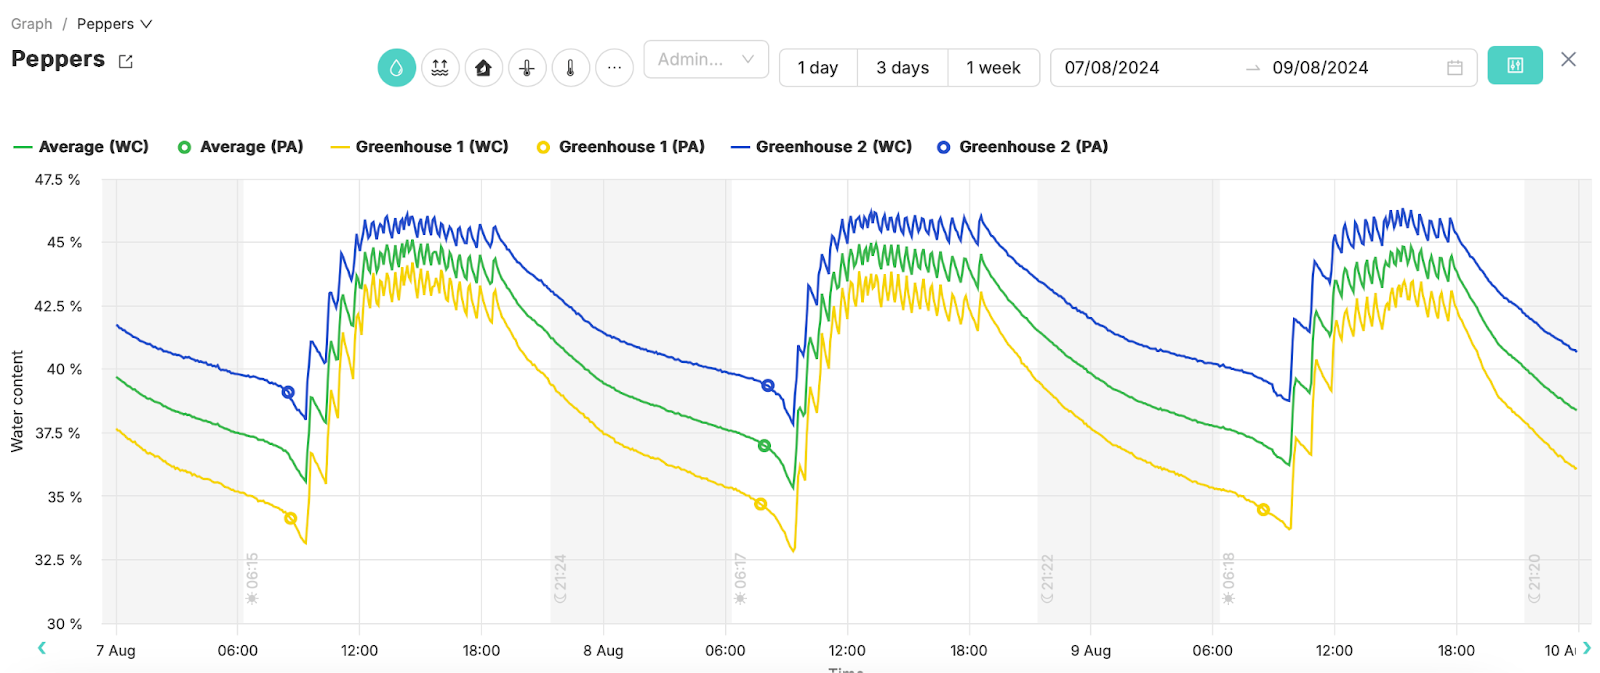
- When you look at the water content graphs, you can see that the water content on the 8th for Greenhouse 2 is fairly stable, but the water content in Greenhouse 1 seems to gradually decrease
- This means that the plants in Greenhouse 1 were most likely more active and should have received slightly more water compared to the plants in Greenhouse 2
Example 4: Use of misting
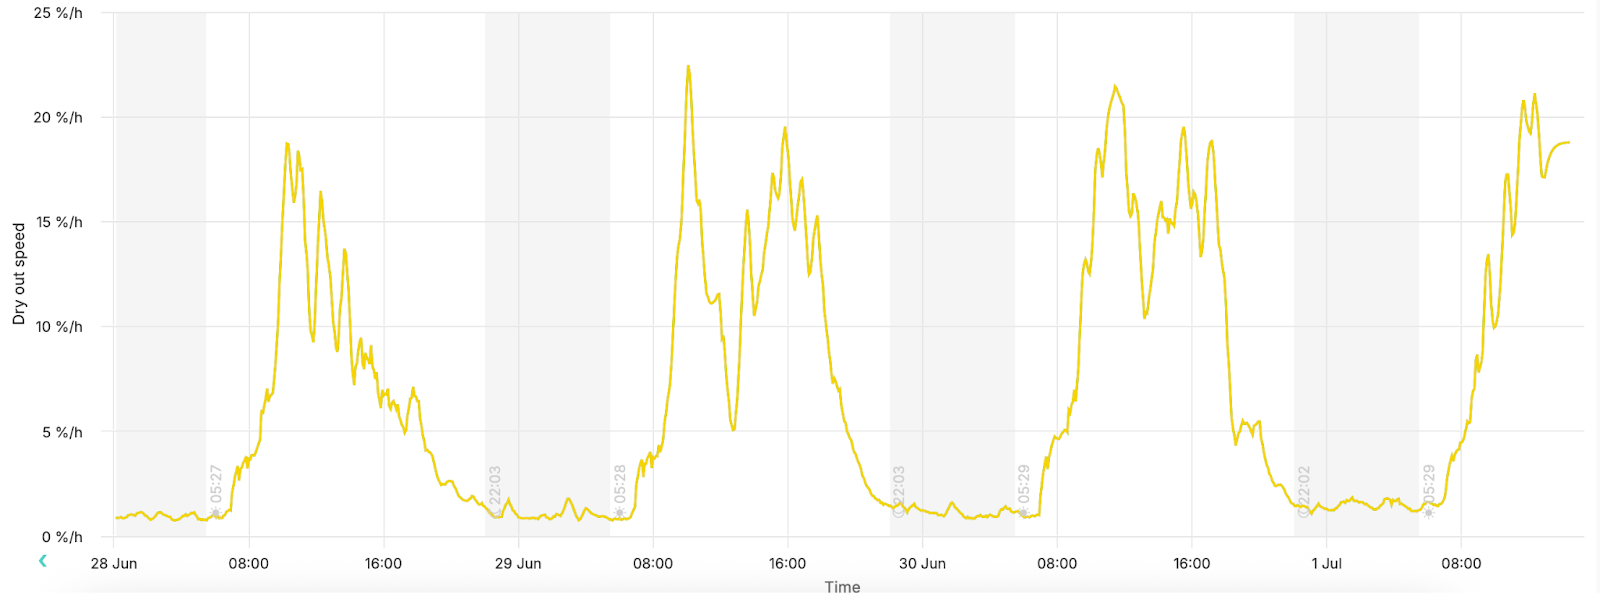
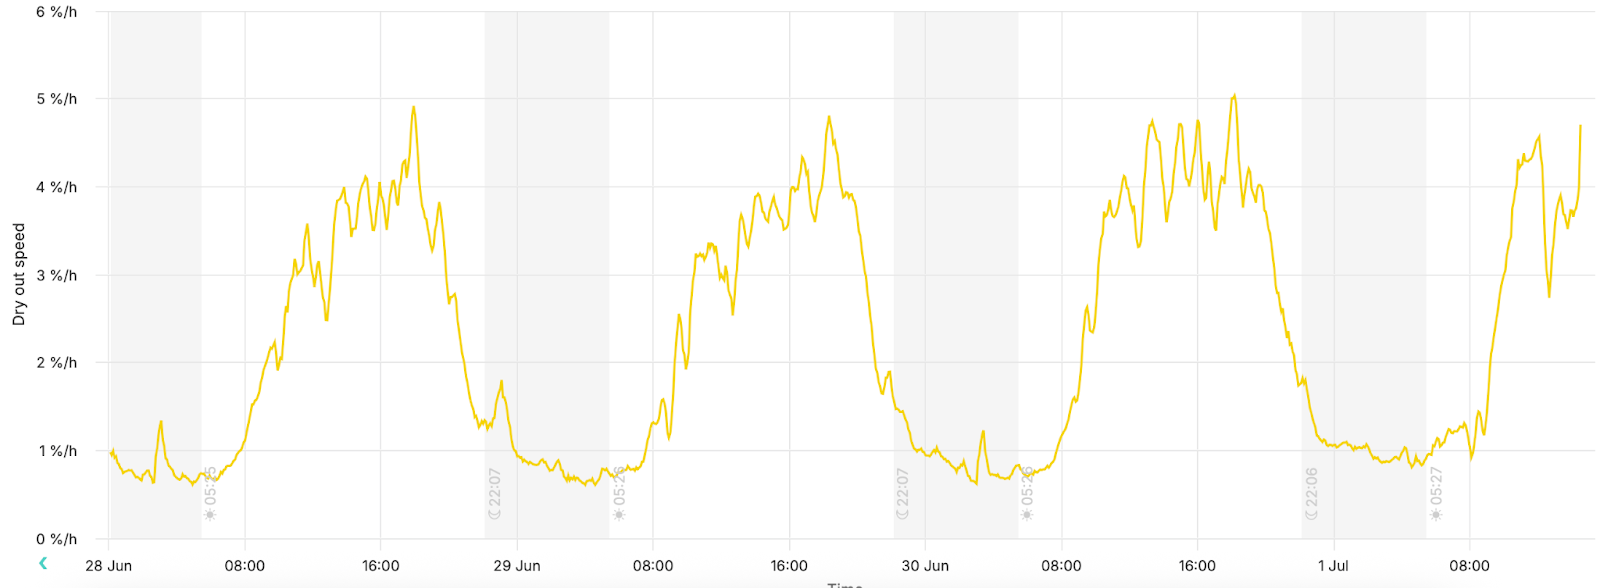
- In this example you can can see the use of misting has on the water uptake of the plants
- On the first day (June 28th), no misting was used and the water uptake is as expected and has a normal dry out line
- On the second and third day (June 29th and June 30th) you can see a big dip during the afternoon in water uptake
- This is when the misting is operational and greatly lowers the water uptake of the plant
- With this information you could adjust your misting length and frequency, or adjust your irrigation accordingly
Setting thresholds for dry out/dry back
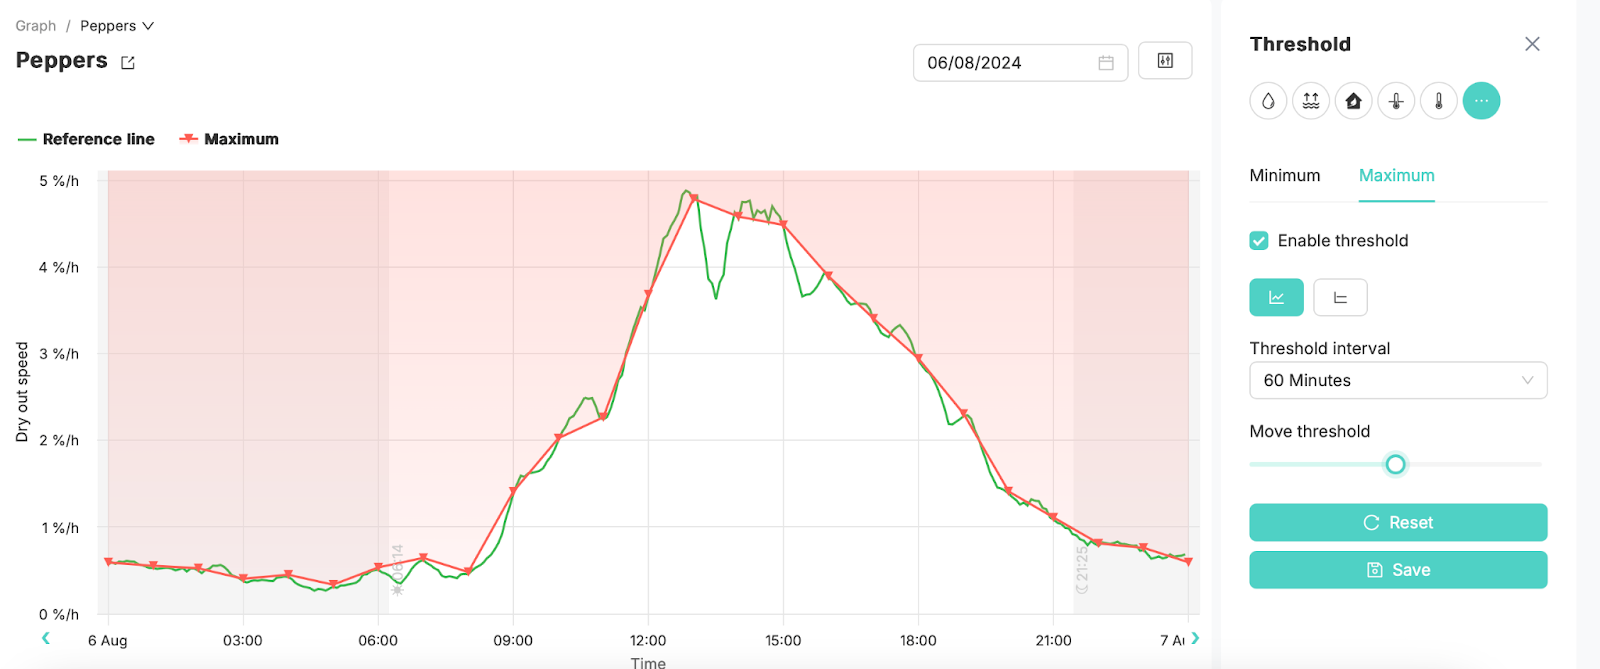
- You can also set thresholds for dry out/dry back to generate a notification of sudden uptake of water and/or need for an irrigation shot
- This helps you decide if an irrigation shot is needed or not, and helps you precisely control your slab moisture, particularly during the night