![Growficient_donkergroen copy.png]](https://help.growficient.com/hs-fs/hubfs/Growficient_donkergroen%20copy.png?height=40&name=Growficient_donkergroen%20copy.png)
Drain is one of the most important measurement types to determine the water and EC balance available to the plant. The Growficient sensors measure the water uptake, water content, and EC in the slab, however there is also a strong interaction of the drip, drain, water amount, and EC.
This is why we have developed drain graphs to help you have clear insight in the relationship of your drain to your dry-out and water content. We are also actively developing our own drip and drain sensors.
Currently, you can connect external drain sensors to your climate computer and view the data on your Growboard as well. After connecting the drain sensor and climate computer to your Growboard, all your information can be easily accessed by the following steps:
- Open the drain graph by opening a graph of the level you want to view
- In the graph menu bar, click the button with 3 dots and select ‘Drain’
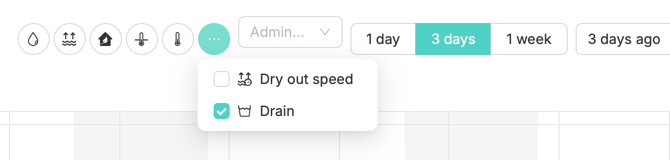
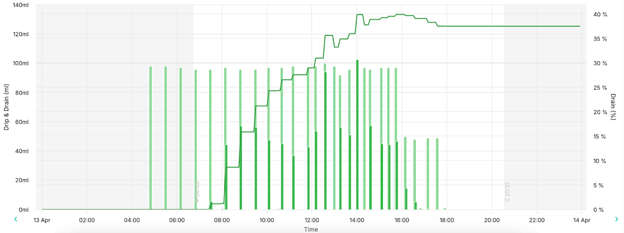
- By default, you will see your Cumulative drain percentage (line), and your drip and drain amount (bars)
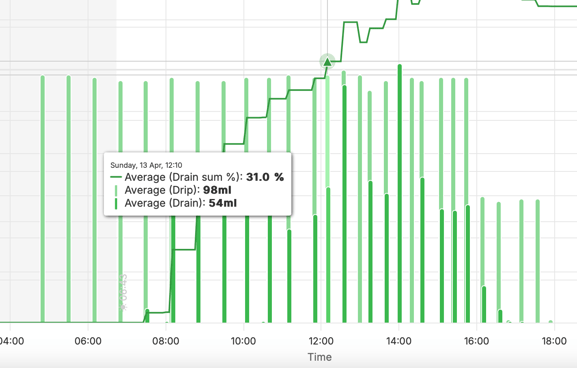
- You will see the actual readings by hovering your mouse over the spot you want to inspect
What are the different measurement types I can see?
By default, you will see your drip and drain amount in milliliters (ml) and your total drain percentage. However, other measurement types are also available to suit your situation.
When you click on the Legend with the small arrow, you will see the following measurement types:
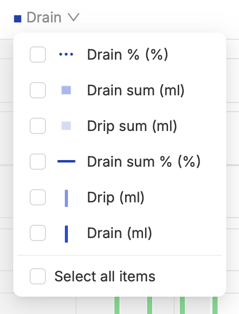
In short, these are:
- Drain %: The drain percentage per irrigation shot
- Drain sum (ml): The total amount of drain in ml
- Drip sum (ml): The total amount of drip in ml
- Drain sum %: The cumulative drain percentage
- Drip (ml): The drip amount in ml per irrigation shot
- Drain (ml): The drain amount in ml per irrigation shot
Example: Drain percentage per irrigation shot
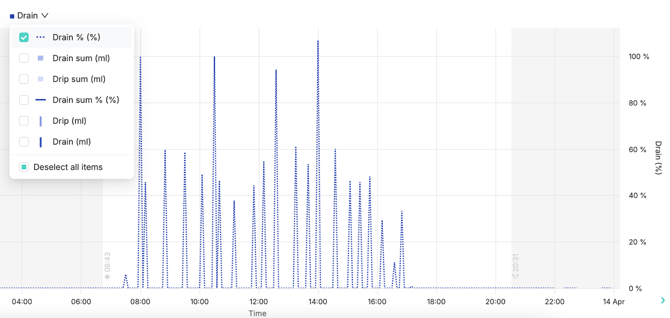
This graph shows the percentage of drain accumulated between irrigation shots. Here, you can quickly see on which irrigation shots you generated the least/most amount of drain and adjust where necessary.
Example: Total amount of drain / drip in ml
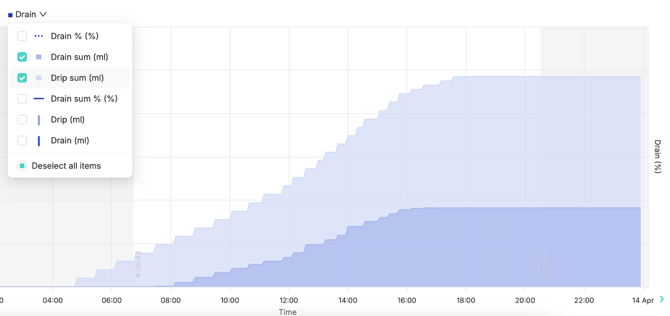
This graph shows the cumulative total amount of drip and drain water calculated in ml. This graph is especially useful if you prefer to see the absolute water amounts you accumulated in the drain in relation to your irrigation water amount. By selecting both types, you can clearly see how your drip irrigation correlates with your drain amount.
Example: Cumulative drain percentage
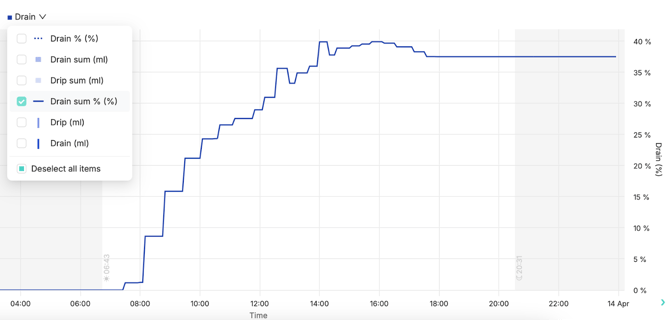
This graph shows the cumulative drain percentage calculated from your total irrigation and drain amount. It lets you see the relationship between drip and drain amount in an easy-to-read percentage. Here, you can see how fast your drain drain builds up over the day, whether you reach your desired drain amount too early or too late, and make adjustments to your strategy accordingly.
Example: Drip / Drain amount in ml per irrigation shot
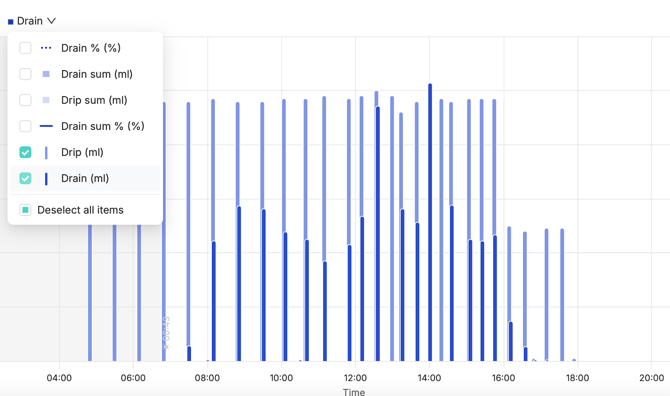
This graph shows the correlation between your drip and drain amount in between shots. The drain starts accumulating when you have your first drip and resets when a second irrigation shot is detected. Here, you can quickly see after how many irrigation turns are needed to reach drain, and whether your current shot size generate too small or large drain moments over the day.
How can I see my drain information in my Growboard overview?
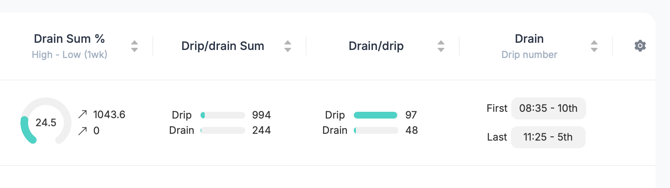
Besides the graphs, all drain information is also available for you Growboard overview. This way you can quickly see your current drain information without having to open the graph.

You can add your drain information to your overview with the following steps:
- Edit your columns by clicking on the cog icon on the right of the column headers
- Click on the drop-down menu to select which values should be visible in your overview
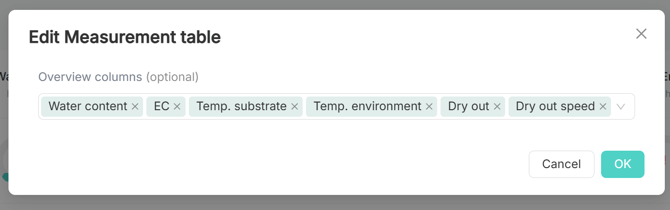
- Here you will have the following new Drain options:
- Drain %: The drain percentage per irrigation shot
- Drain sum (ml): The total amount of drain in ml
- Drip sum (ml): The total amount of drip in ml
- Drain sum %: The cumulative drain percentage
- Drip (ml): The drip amount in ml per irrigation shot
- Drain (ml): The drain amount in ml per irrigation shot
- After selecting your desired columns they will appear in the overview