![Growficient_donkergroen copy.png]](https://help.growficient.com/hs-fs/hubfs/Growficient_donkergroen%20copy.png?height=40&name=Growficient_donkergroen%20copy.png)
This article details how to use the different functions of the graph tool.
Sensor data
The sensors report 5 different measures:
- Water content
Relative water content of the substrate: 0% means no water in the substrate, 100% means full submersion
- Dry out/Dryback
Drying of the substrate, relative to the last shot/watering: when irrigating, dry out drops to 0 and when irrigation stops, the dry out graph will show the amount of water leaving the substrate
- EC
Electrical conductivity, translating to the amount of minerals in the substrate
- Substrate temperature
Temperature measured with the pins in the substrate
- Temperature of the environment
Atmospheric temperature, measured by a sensor inside the casing of the sensor (and therefore, sensitive to direct sunlight on the casing)
- For Optimize-subscribers: Dry out speed
- For Optimize-subscribers: Drain
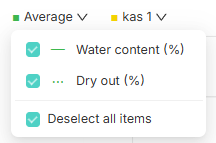
You can view these values on location, compartment, section, placement, and sensor level. All graphs will also automatically show you an average line in green. You can turn the average line off by unticking the box from the 'Average' drop-down menu.
You can view a maximum of two different measures at once to keep the graph clear and easily readable. You can choose which two to view using these icons on top of the graph:
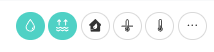
The three dots will open any other measures that may be included in your subscription, such as dry out speed and drain.
Time scope
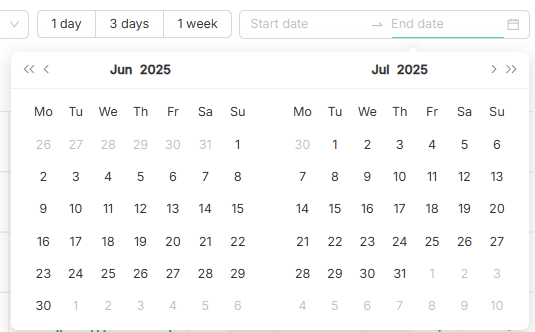
By default, the graph shows you the values of the past 3 days. You can easily change this to 1 day or 1 week with these buttons, or use the date picker to set a custom range for time.
Interval of data points
The data is transferred via the gateway to the Growboard every 5 minutes and therefore, the data is, by default, shown in 5 minute intervals. However, it is also possible to view your data in larger intervals, example to view EC and temperature trends on a weekly basis.
You can edit the interval of the data points from this button in the top right corner, next to the date picker.
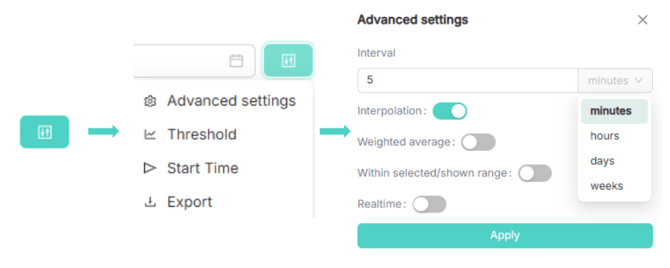
You can type in the interval of your choice and pick the time unit from the drop-down menu. Remember to click 'Apply' to confirm the changes.
Please note: Since the Growficient sensors measure every 5 minutes, the data shown in the intervals are calculated and extrapolated values and not actual readings.
Sunrise and sunset times
Please see the Indoor lighting settings article.