![Growficient_donkergroen copy.png]](https://help.growficient.com/hs-fs/hubfs/Growficient_donkergroen%20copy.png?height=40&name=Growficient_donkergroen%20copy.png)
This article details how you can set up your own dashboard with the 'Custom dashboard' tab. The dashboard will draw data from your own location's/locations' Growboard.
Follow the steps below to create your custom dashboard:
- Create a new dashboard as described in the Getting started article
- Click on the dashboard name under personal or your company name to start editing the dashboard
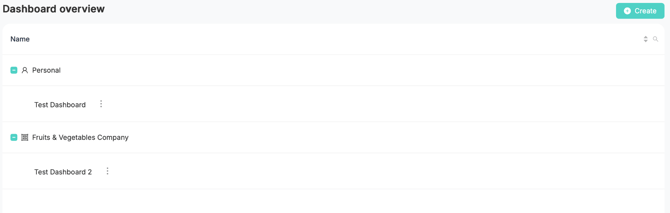
- Personal dashboards are only visible to you, company dashboards can be seen by every member of your company
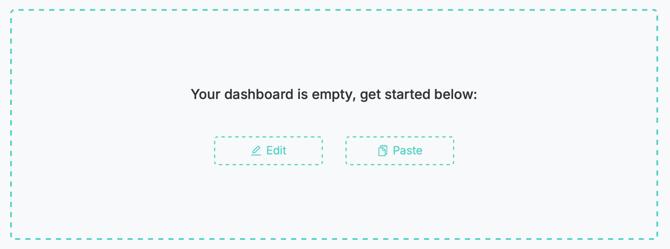
- After clicking on the dashboard name, you will see the following screen first
- Here you can choose whether to start editing an empty dashboard or pasting in a template or an existing dashboard you've made previously
-
- Edit: You can start a new dashboard from the beginning
- Paste: Paste a previously made dashboards and start editing from there
- When clicking 'Edit' to start fresh, you will land on the editing screen of the custom dashboard
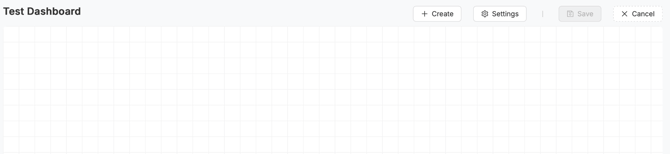
- You will see a blank screen with grids as your background
- In the top right corner you will see 4 buttons:

- With these buttons you can:
- Create: Add new tiles to your dashboard
- Settings: Edit settings regarding your dashboard
- Save: Save your dashboard
- Cancel: Cancel editing your dashboard
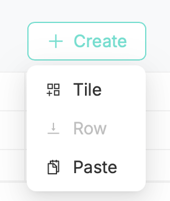
- By clicking on the 'Create' button you will have the following options:
-
- Tile: Add a new Tile
- Row: Add a Row
- Paste: Paste a previously copied Tile
- Click on 'Create: Tile' to add a new tile to your dashboard and choose the type of data you want to see in that tile
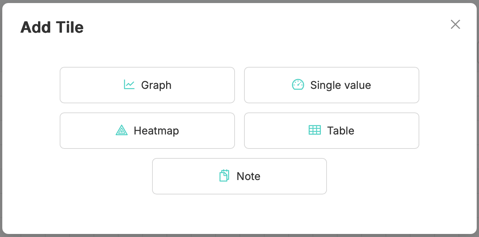
- We have different tile types depending on the type of information you want to add
- Graph: Add a graph tile, comparable to the standard graphs
- Single Value: Add a single value of any of your measurements to the overview
- Heatmap: Add a heatmap to your dashboard
- Table: Add a table comparable to the default overview
- Note: Add a note to help clarify information on the dashboard
- Adding a tile will open the respective tool for setting it up; here you can specify exactly what data you want to see and how
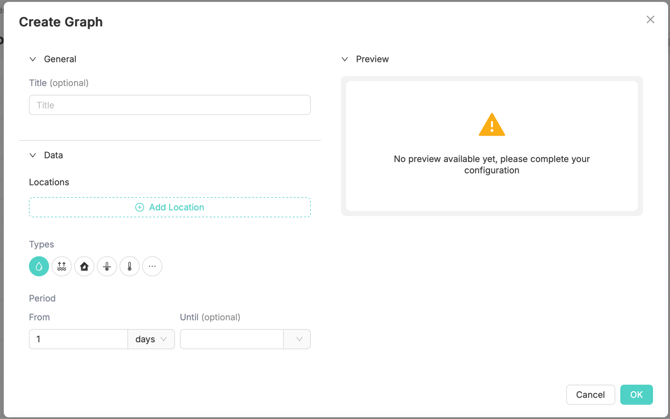
- In the tile setup screen, all settings are grouped under specific topics
- General: General information, such as the name of the tile
- Data: Selection of data(points) you would like to see
- Visibility: Styling options of the tile
- Preview: A preview of the tile with the current settings, updating in real time
- The arrows next to the topic name will close the topic for more space for you to adjust the next topic
- Click on ‘OK’ to add the tile to your dashboard
- Click and drag the tile to your desired location
- Click and hold the bottom right corner to adjust the size of the tile
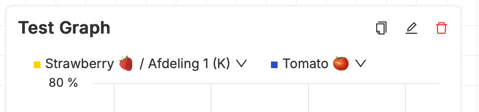
- When you hover your mouse over a tile, you will see 3 options in the top right corner
- These options allow you to:
- Copy: Copy the tile to quickly create a second copy
- Edit: Edit the tile settings to make adjustments on the tile
- Delete: Removes the tiles from the dashboard
- If you copy a tile, you can click on 'Create: Paste' to paste the copied tile on the dashboard
- You can edit this tile (for example by choosing a different range, or location) to quickly add tiles in a style suitable for you
- After adding your tiles to the Dashboard click on the ‘Save’ button in the right top corner
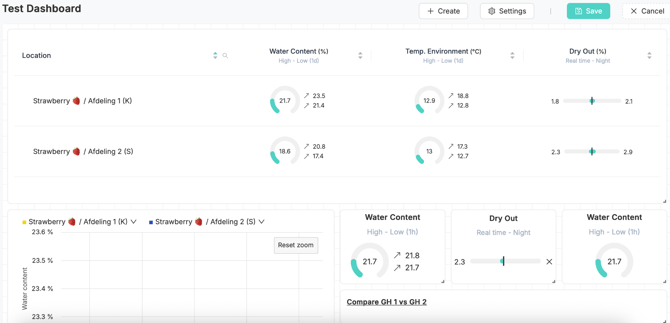
Note! Make sure to click Save before exiting your Dashboard. Changes are not automatically saved.
- After saving the dashboard you will have the following 3 options in the top right corner

- These are:
- Present: Sets the dashboard in full-screen mode, so you can leave it open on you computer for easy visibility
- Copy: Copies the entire dashboard, so it can be pasted into a new personal or company dashboard
- Edit: Edit the current dashboard